Summary
- Question: on a real vLLM 0.30 server, does ordering the waiting queue by a predicted output length (shortest predicted first) raise strict-SLO performance over vLLM's default FCFS, and how close is a decision model (Jev 1.13) to the true length? Does the calibrated simulator predict the real server?
- Setting: Qwen3-8B on one H200, KV cache capped at 84,000 tokens (about 60 thinking-on requests at once), 2,000 ShareGPT requests with Qwen3-8B's logged thinking-on output lengths, Poisson arrivals at 1.05-1.54 requests/s. SLO: TTFT <= 1 s and TPOT <= 50 ms; target: 90% of requests.
- Results (arrival draw 0, same rates for every policy):
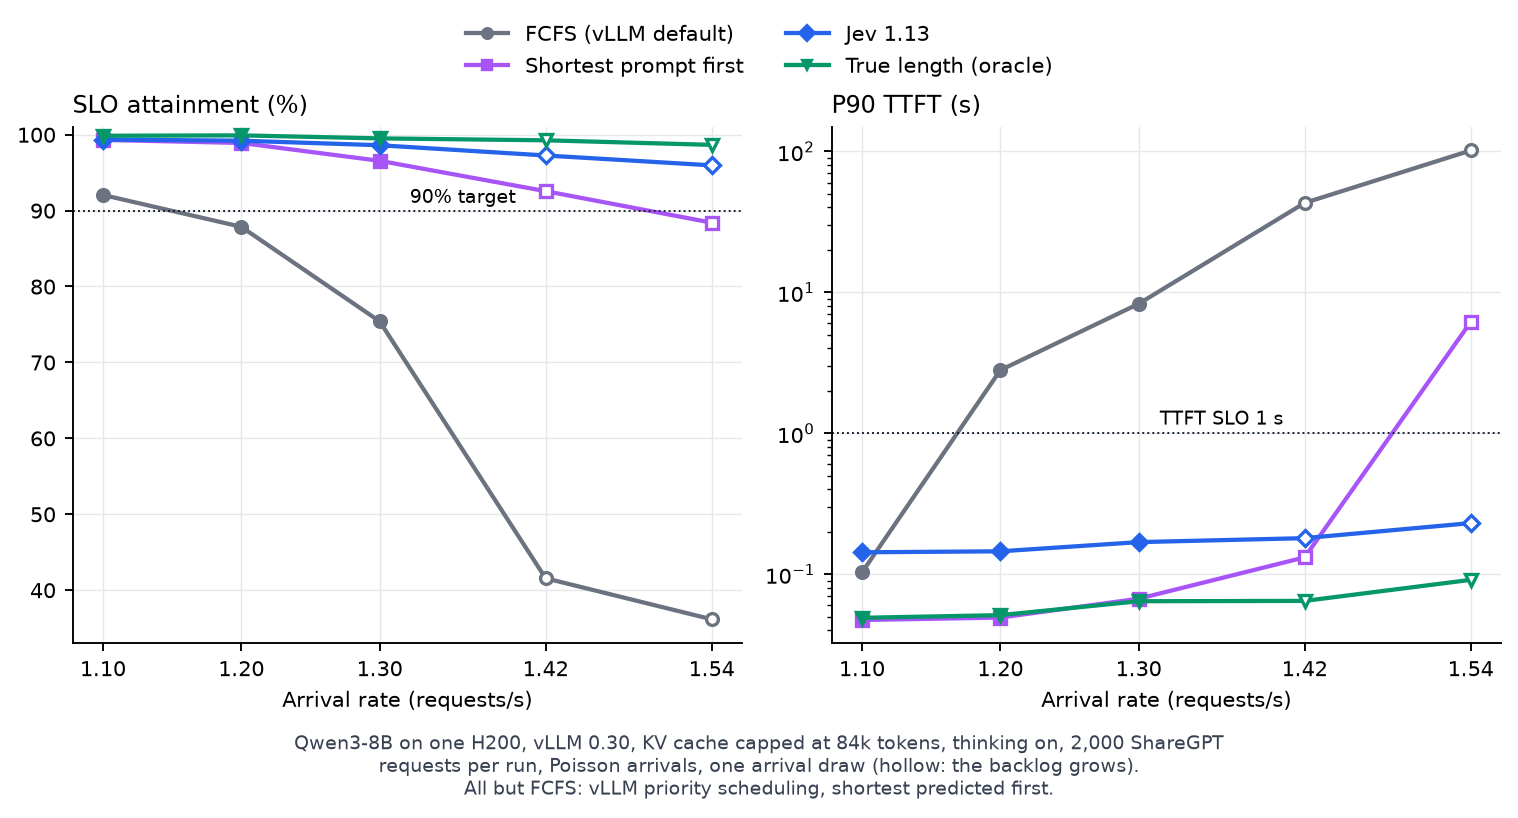
- FCFS falls below 90% attainment just above 1.10 req/s (92.0% at 1.10, 75.4% at 1.30, 41.5% at 1.42).
- Every reordering keeps attainment high much longer:
Policy Attainment at 1.30 req/s Attainment at 1.54 req/s Shortest prompt first 96.5% 88.4% LTR ranker 98.1% 95.5% Jev 98.6% 96.0% True length 99.5% 98.7% - From about 1.36-1.42 req/s, every reordering lets the backlog of deferred long requests grow (starvation), before attainment falls below 90%.
- Goodput (highest rate with attainment >= 90% and no growing backlog), arrival draw 0:
Policy Goodput (req/s) FCFS 1.127 Shortest prompt first 1.30-1.42 LTR 1.30-1.36 Jev 1.30-1.36 True length 1.36-1.42 The shortest-first policies are bracketed because the backlog, not attainment, is what fails first. Real gain of Jev over FCFS: +15% to +21% (draw 0) and +16% to +26% (draw 1).
- Where predictors differ: attainment at high load (above), and the TTFT tail.
- P99 TTFT at 1.30 req/s: shortest prompt first 52.9 s, LTR 22.0 s, Jev 2.7 s, true length 0.4 s.
- Jev's P90 TTFT is the highest of the reorderings at low load (0.14 s vs 0.05-0.07 s) because its 92 ms decision latency is added to every request.
- Why reordering helps even without a model: vLLM admits the queue's head only if its whole prompt fits in the free KV blocks and stops at the first that does not. Under FCFS one long prompt at the head blocks every request behind it; serving short requests first keeps admission flowing. Output-length prediction adds to this at high load and in the tail.
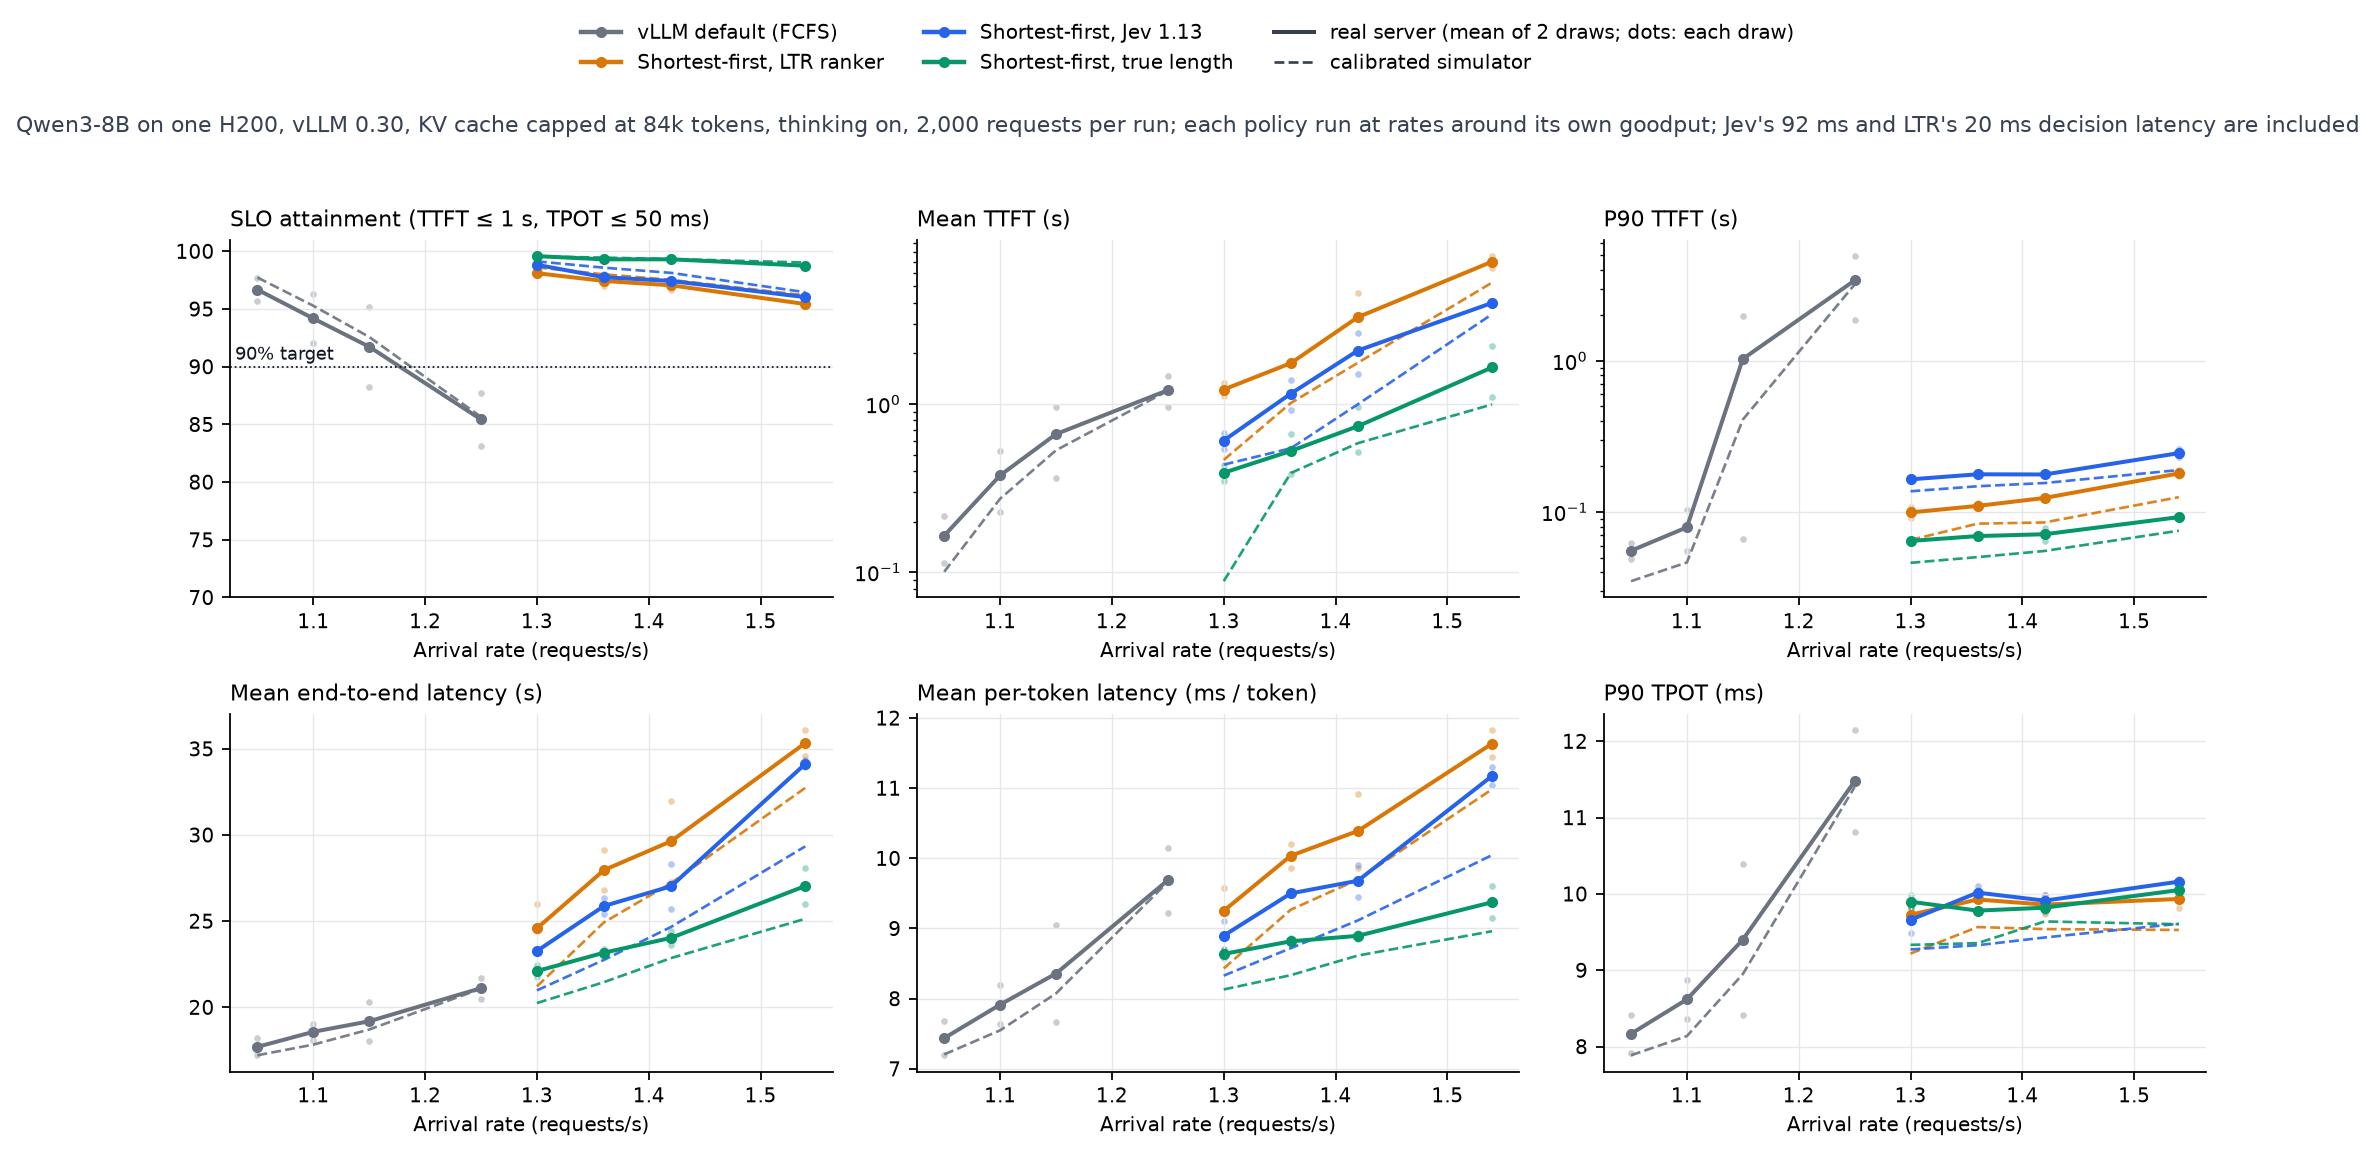
- Simulator: after calibration, real and simulated attainment differ by at most 2.1 points in all 32 runs of rounds 1-2 (2.6 points over all 47 runs, all policies). The keep-up verdict agrees in 44 of 47. TPOT p50 is within 0-10%. The simulator underestimates the mean and P99 TTFT of the shortest-first policies (the deferred tail) by up to about 2x.
Setup
| Item | Value |
|---|---|
| Hardware | 8x NVIDIA H200 (143,771 MiB) in one host, 192 CPU cores; one server per GPU, up to 8 runs at once |
| Engine | vLLM 0.30.0 (V1), OpenAI-compatible server |
| Model | Qwen/Qwen3-8B, revision b968826d9c46dd6066d109eabc6255188de91218, bf16 |
| Server flags | --max-model-len 24576 --no-enable-prefix-caching --num-gpu-blocks-override 5250 --scheduling-policy fcfs or priority |
| Effective configuration | KV cache 84,000 tokens (5,250 blocks of 16); chunked prefill; 8,192 batched tokens per step; 1,024 sequences (vLLM 0.30 default on H200); recompute preemption; CUDA graphs up to batch 512; no reasoning parser |
| Workload | first 2,000 test-split ShareGPT first-turn prompts (single-turn chat) |
| Output lengths | Qwen3-8B's own thinking-on generations logged earlier (temperature 0.6, top_p 0.95, top_k 20, max_tokens 16,384; thinking tokens counted), forced by max_tokens = logged length and ignore_eos: true (temperature 0 at replay) |
| Length statistics | prompt mean 245 / p50 44 / p99 2,862 / max 4,059 tokens; output mean 2,402 / p50 1,692 / p90 4,932 / p99 16,384 (cap; 21 requests) |
| Arrivals | Poisson: one unit-rate trace per seed (2,000 exponential gaps rescaled to exactly 1 request/s), divided by the rate; identical arrival times for every policy at a given seed and rate |
| Client | one process per server (httpx async, streaming); dispatch lag 0.6-0.7 ms median, under 75 ms max |
| Warm-up | 8 training-split prompts x 16 tokens before each run |
Policies
All but FCFS use --scheduling-policy priority with per-request priority = round(1000 x log2(predicted output length)), smaller first. Waiting requests never preempt running ones; under memory pressure vLLM preempts the lowest-priority running request.
| Policy | Predicted length | Decision latency (added before sending) |
|---|---|---|
| FCFS (vLLM default) | none | 0 |
Shortest prompt first (spf) | prompt token count | 0 |
LTR ranker (ltr) | LTR-style ranker reimplemented after Fu et al. (NeurIPS'24): OPT-125M, ListMLE, trained on 13,914 training prompts' Qwen3-8B thinking-on lengths | 20 ms (assumed) |
Jev 1.13 (jev) | Jev's answers to 6 length questions, mapped to log2 length by ridge regression fit on the same 13,914 training prompts | 92 ms (measured median) |
True length (oracle) | the logged output length | 0 |
Prediction quality on the 6,086 thinking-on test prompts (Kendall tau): Jev 0.559, LTR 0.545, prompt length 0.114. A second answer sampled for the same prompt reaches 0.725, the practical ceiling of any predictor that sees only the prompt.
Metrics
- TTFT = time of the first streamed chunk with non-empty content (thinking text counts) - scheduled arrival.
- TPOT = (stream end - first token) / (output tokens - 1).
- SLO attainment = share of the 2,000 requests with TTFT <= 1 s and TPOT <= 50 ms.
- Backlog grows / keeps up: over the middle 60% of the trace by arrival time, the server keeps up if its backlog of tokens still to process grows by at most 3% of the tokens that arrive. A waiting request counts its whole prompt and output; a decoding request counts the share of its output still to come.
- Goodput (per arrival draw) = the highest rate run at which attainment >= 90% and the server keeps up. It is interpolated linearly where attainment crosses 90% between two rates. Where the backlog starts to grow first, it is reported as the bracket [last passing rate, first failing rate).
- Server-side means (TTFT, inter-token latency) come from vLLM's
/metricshistograms. Client and server TTFT agree except for the decision latency, which only the client counts (e.g. Jev at 1.10: 0.15 s client vs 0.05 s server).
Runs
| Round | Runs | Configurations | Status |
|---|---|---|---|
| 0 | 8 | KV 84k: FCFS / Jev / true length at 1.225 and 1.472; KV 190k: FCFS / Jev at 2.099; draw 0 | superseded (one client process for 8 servers lagged; prefix caching on); used to find the simulator's biases |
| calibration | 6 | decode and prefill step times, TTFT probes | used to fit the simulator's H200 profile |
| 1 | 24 | FCFS 1.05 / 1.15 / 1.25; Jev, LTR, true length 1.30 / 1.42 / 1.54; draws 0 and 1 | done |
| 2 | 8 | Jev, LTR, true length 1.36; FCFS 1.10; draws 0 and 1 | done |
| 3 | 15 | FCFS 1.20 / 1.30 / 1.42 / 1.54; shortest prompt first 1.10-1.54; Jev, LTR, true length 1.10 / 1.20; draw 0 | done |
| 3, draw 1 | 15 | the same for draw 1 | deferred (11 placeholders, 4 stopped) |
Each run takes 25-33 minutes. Rounds 1-3 total 47 completed runs.
Results: every policy at the same rates (arrival draw 0)
SLO attainment (* = the backlog grows)
| Policy | 1.10 | 1.20 | 1.30 | 1.42 | 1.54 |
|---|---|---|---|---|---|
| FCFS (vLLM default) | 92.0% | 87.8% | 75.4% | 41.5%* | 36.1%* |
| Shortest prompt first | 99.3% | 98.9% | 96.5% | 92.5%* | 88.4%* |
| LTR ranker | 99.5% | 99.2% | 98.1% | 96.6%* | 95.5%* |
| Jev 1.13 | 99.4% | 99.2% | 98.6% | 97.2%* | 96.0%* |
| True length (oracle) | 99.9% | 99.9% | 99.5% | 99.2%* | 98.7%* |
Mean TTFT (s) (* = the backlog grows)
| Policy | 1.10 | 1.20 | 1.30 | 1.42 | 1.54 |
|---|---|---|---|---|---|
| FCFS (vLLM default) | 0.52 | 1.05 | 2.31 | 16.11* | 37.91* |
| Shortest prompt first | 0.17 | 0.26 | 1.56 | 12.10* | 33.22* |
| LTR ranker | 0.09 | 0.20 | 1.33 | 4.57* | 6.45* |
| Jev 1.13 | 0.15 | 0.38 | 0.68 | 2.65* | 3.89* |
| True length (oracle) | 0.05 | 0.05 | 0.43 | 0.96* | 1.10* |
P90 TTFT (s) (* = the backlog grows)
| Policy | 1.10 | 1.20 | 1.30 | 1.42 | 1.54 |
|---|---|---|---|---|---|
| FCFS (vLLM default) | 0.10 | 2.80 | 8.27 | 43.02* | 101.27* |
| Shortest prompt first | 0.05 | 0.05 | 0.07 | 0.13* | 6.14* |
| LTR ranker | 0.07 | 0.07 | 0.11 | 0.13* | 0.17* |
| Jev 1.13 | 0.14 | 0.15 | 0.17 | 0.18* | 0.23* |
| True length (oracle) | 0.05 | 0.05 | 0.06 | 0.06* | 0.09* |
P99 TTFT (s) (* = the backlog grows)
| Policy | 1.10 | 1.20 | 1.30 | 1.42 | 1.54 |
|---|---|---|---|---|---|
| FCFS (vLLM default) | 10.5 | 19.2 | 28.5 | 93.8* | 163.6* |
| Shortest prompt first | 0.4 | 2.7 | 52.9 | 445.2* | 764.5* |
| LTR ranker | 0.4 | 0.6 | 22.0 | 93.3* | 224.1* |
| Jev 1.13 | 0.5 | 0.6 | 2.7 | 39.4* | 171.6* |
| True length (oracle) | 0.3 | 0.3 | 0.4 | 0.5* | 2.1* |
Mean end-to-end latency (s) (* = the backlog grows)
| Policy | 1.10 | 1.20 | 1.30 | 1.42 | 1.54 |
|---|---|---|---|---|---|
| FCFS (vLLM default) | 19.0 | 20.2 | 24.1 | 44.3* | 69.5* |
| Shortest prompt first | 18.4 | 19.1 | 23.3 | 38.3* | 65.8* |
| LTR ranker | 18.5 | 19.5 | 26.0 | 32.0* | 34.6* |
| Jev 1.13 | 18.6 | 19.6 | 24.4 | 28.3* | 33.9* |
| True length (oracle) | 17.9 | 19.4 | 22.4 | 24.4* | 26.0* |
Results: goodput
| Policy | Draw 0, real | Draw 0, simulated | Draw 1, real | Draw 1, simulated |
|---|---|---|---|---|
| FCFS | 1.127 (interpolated) | 1.159 | 1.219 (interpolated) | 1.217 |
| Shortest prompt first | 1.30-1.42 (backlog) | - | not run | - |
| LTR ranker | 1.30-1.36 (backlog) | 1.360 | 1.42-1.54 (backlog) | 1.490 |
| Jev 1.13 | 1.30-1.36 (backlog) | 1.409 | 1.42-1.54 (backlog) | 1.510 |
| True length | 1.36-1.42 (backlog) | 1.419 | >= 1.54 | 1.575 |
The calibrated simulator's goodput averaged over both draws: FCFS 1.188, shortest prompt first 1.394, LTR 1.425, Jev 1.460, true length 1.497 req/s (+17%, +20%, +23%, +26% over FCFS).
Results: real server vs calibrated simulator
- Rounds 1-2 (32 runs): attainment within 2.1 points in every run; keep-up verdict agrees in 29 of 32.
- All 47 runs: attainment within 2.6 points (largest: FCFS at 1.42 req/s, draw 0, 41.6% real vs 44.2% simulated); keep-up verdict agrees in 44 of 47. The three disagreements are Jev and LTR at 1.36 and the true length at 1.42 (all draw 0): the simulator says the server keeps up, the real server's backlog grows.
- TPOT p50 within -1% to +10%; mean end-to-end latency -2% to +23% (median +6%; the real server is slower).
- TTFT: FCFS matches well (e.g. 1.25 req/s draw 0: 1.46 s real, 1.47 s simulated). For the shortest-first policies at high load, the simulator's mean and P99 TTFT are up to about 2x lower: the requests they defer wait longer on the real server.
- Preemptions: same order of magnitude (real -28% to +43% relative to simulated).
- Calibration that made this agreement possible:
- Step times measured on the real H200:
base 5.08 ms + 16.4 us x seqs + 41.4 us x max(0, seqs - 320) + 31.4 ns x context tokens; prefill22.6 us x tokens + 1.1e-9 s x tokens x context attended. - One client process per server (round 0's shared client lagged by 10-40 ms median).
- vLLM's default memory utilization (0.92).
- Step times measured on the real H200:
Interpretation
- Admission packing: in this memory-bound setting, the largest part of the gain over FCFS comes from not blocking admission behind a request that does not fit. Shortest prompt first, which knows nothing about output length, already moves attainment at 1.42 req/s from 41.5% (FCFS) to 92.5%.
- Output-length information adds attainment at high load and shortens the TTFT tail. The ordering is clear: true length > Jev ~ LTR > shortest prompt first > FCFS. Jev and LTR are close; Jev has the shorter tail at 1.30-1.42 req/s, LTR the lower P90 at low load because of Jev's decision latency.
- Starvation binds before the SLO for every shortest-first policy, from about 1.36-1.42 req/s. That is why their goodput is bracketed and nearly tied. Starvation control (aging) would be needed to push goodput further and to separate predictors by goodput.
- The setting matters: these gains need a small KV pool (tens of requests at once). On default deployments with hundreds of requests in the cache, the simulator finds 0-3% goodput gains even with the true length (the simulated deployment sweep).
Caveats
- One model and GPU type; the small KV pool is imposed with
--num-gpu-blocks-override, not a natural deployment. - One workload (ShareGPT first turns, thinking on) and Poisson arrivals only.
- The same-rate comparison uses one arrival draw; draws differ by up to ~8% in FCFS goodput (1.127 vs 1.219).
- Rates are 6-12% apart, so backlog-limited goodput is only bracketed.
- LTR's 20 ms decision latency is assumed, not measured.
- Prefix caching is off, and TTFT counts the first thinking token.
Every run
Show all 47 runs
| policy | rate | seed | attainment real (sim) | backlog grows real (sim) | mean TTFT s: client / server / sim | P90 TTFT s real (sim) | P99 TTFT s real (sim) | mean e2e s real (sim) | TPOT p50 ms real (sim) | preemptions real (sim) |
|---|---|---|---|---|---|---|---|---|---|---|
| fcfs | 1.05 | 0 | 95.7% (97.2%) | no (no) | 0.22 / 0.21 / 0.12 | 0.06 (0.04) | 5.0 (4.2) | 18.2 (17.3) | 7.2 (7.0) | 408 (296) |
| fcfs | 1.05 | 1 | 97.7% (98.2%) | no (no) | 0.11 / 0.11 / 0.08 | 0.05 (0.03) | 3.1 (2.3) | 17.2 (17.1) | 7.0 (7.0) | 199 (197) |
| fcfs | 1.10 | 0 | 92.0% (93.5%) | no (no) | 0.52 / 0.52 / 0.36 | 0.10 (0.05) | 10.5 (9.8) | 19.0 (18.1) | 7.4 (7.1) | 641 (476) |
| fcfs | 1.10 | 1 | 96.3% (97.0%) | no (no) | 0.23 / 0.22 / 0.19 | 0.06 (0.04) | 8.2 (7.5) | 18.1 (17.6) | 7.3 (7.1) | 341 (297) |
| fcfs | 1.15 | 0 | 88.2% (90.3%) | no (no) | 0.96 / 0.95 / 0.68 | 1.99 (0.76) | 17.6 (13.9) | 20.3 (19.1) | 7.5 (7.2) | 937 (820) |
| fcfs | 1.15 | 1 | 95.2% (94.8%) | no (no) | 0.36 / 0.36 / 0.38 | 0.07 (0.06) | 12.8 (12.4) | 18.1 (18.3) | 7.2 (7.2) | 445 (539) |
| fcfs | 1.20 | 0 | 87.8% (87.1%) | no (no) | 1.05 / 1.05 / 0.99 | 2.80 (2.54) | 19.2 (17.9) | 20.2 (20.3) | 7.4 (7.4) | 1050 (1141) |
| fcfs | 1.25 | 0 | 83.2% (83.1%) | no (no) | 1.46 / 1.45 / 1.47 | 4.93 (4.83) | 19.3 (19.8) | 21.7 (21.8) | 7.5 (7.6) | 1510 (1577) |
| fcfs | 1.25 | 1 | 87.7% (88.2%) | no (no) | 0.96 / 0.95 / 0.92 | 1.86 (1.57) | 19.1 (19.4) | 20.5 (20.4) | 7.5 (7.6) | 1284 (1158) |
| fcfs | 1.30 | 0 | 75.4% (76.4%) | no (no) | 2.31 / 2.30 / 2.25 | 8.27 (8.09) | 28.5 (29.1) | 24.1 (23.6) | 7.8 (7.8) | 2165 (1881) |
| fcfs | 1.42 | 0 | 41.5% (44.1%) | yes (yes) | 16.11 / 16.11 / 13.54 | 43.02 (38.98) | 93.8 (79.4) | 44.3 (41.5) | 10.1 (10.1) | 4911 (4729) |
| fcfs | 1.54 | 0 | 36.1% (37.8%) | yes (yes) | 37.91 / 37.90 / 36.36 | 101.27 (99.27) | 163.6 (152.1) | 69.5 (67.0) | 11.2 (11.1) | 5531 (5373) |
| spf | 1.10 | 0 | 99.3% (99.2%) | no (no) | 0.17 / 0.16 / 0.13 | 0.05 (0.03) | 0.4 (0.5) | 18.4 (18.0) | 7.3 (7.1) | 146 (170) |
| spf | 1.20 | 0 | 98.9% (98.9%) | no (no) | 0.26 / 0.26 / 0.26 | 0.05 (0.03) | 2.7 (3.6) | 19.1 (18.8) | 7.5 (7.5) | 243 (243) |
| spf | 1.30 | 0 | 96.5% (97.4%) | no (no) | 1.56 / 1.56 / 0.70 | 0.07 (0.04) | 52.9 (24.9) | 23.3 (21.2) | 8.5 (8.0) | 755 (649) |
| spf | 1.42 | 0 | 92.5% (93.0%) | yes (yes) | 12.10 / 12.09 / 8.40 | 0.13 (0.10) | 445.2 (252.5) | 38.3 (34.1) | 8.8 (8.6) | 1096 (964) |
| spf | 1.54 | 0 | 88.4% (90.6%) | yes (yes) | 33.22 / 33.22 / 25.57 | 6.14 (0.29) | 764.5 (665.2) | 65.8 (53.4) | 9.0 (8.7) | 1331 (1072) |
| ltr | 1.10 | 0 | 99.5% (99.7%) | no (no) | 0.09 / 0.06 / 0.06 | 0.07 (0.05) | 0.4 (0.3) | 18.5 (17.9) | 7.3 (7.1) | 181 (144) |
| ltr | 1.20 | 0 | 99.2% (99.2%) | no (no) | 0.20 / 0.17 / 0.17 | 0.07 (0.05) | 0.6 (0.5) | 19.5 (19.2) | 7.5 (7.5) | 296 (274) |
| ltr | 1.30 | 0 | 98.1% (98.2%) | no (no) | 1.33 / 1.30 / 0.52 | 0.11 (0.07) | 22.0 (5.6) | 26.0 (21.6) | 8.9 (8.2) | 715 (628) |
| ltr | 1.30 | 1 | 98.1% (99.0%) | no (no) | 1.11 / 1.09 / 0.41 | 0.09 (0.06) | 7.1 (1.0) | 23.2 (20.8) | 8.5 (8.1) | 601 (419) |
| ltr | 1.36 | 0 | 97.0% (97.8%) | yes (no) | 1.72 / 1.69 / 1.31 | 0.12 (0.09) | 48.8 (26.4) | 29.1 (26.2) | 9.0 (8.7) | 829 (804) |
| ltr | 1.36 | 1 | 97.9% (98.2%) | no (no) | 1.78 / 1.75 / 0.72 | 0.10 (0.08) | 47.4 (11.6) | 26.8 (23.7) | 9.1 (8.5) | 833 (681) |
| ltr | 1.42 | 0 | 96.6% (97.5%) | yes (yes) | 4.57 / 4.54 / 1.89 | 0.13 (0.09) | 93.3 (55.2) | 32.0 (28.6) | 9.1 (8.7) | 806 (802) |
| ltr | 1.42 | 1 | 97.5% (97.5%) | no (no) | 2.00 / 1.97 / 1.63 | 0.12 (0.08) | 53.7 (32.6) | 27.3 (25.8) | 8.8 (8.7) | 843 (882) |
| ltr | 1.54 | 0 | 95.5% (96.2%) | yes (yes) | 6.45 / 6.42 / 5.22 | 0.17 (0.11) | 224.1 (199.7) | 34.6 (33.0) | 9.0 (8.8) | 1126 (969) |
| ltr | 1.54 | 1 | 95.3% (96.2%) | yes (yes) | 7.58 / 7.56 / 5.31 | 0.19 (0.14) | 321.6 (182.0) | 36.1 (32.5) | 9.2 (8.8) | 1287 (1033) |
| jev | 1.10 | 0 | 99.4% (99.6%) | no (no) | 0.15 / 0.05 / 0.13 | 0.14 (0.13) | 0.5 (0.5) | 18.6 (18.0) | 7.3 (7.1) | 201 (181) |
| jev | 1.20 | 0 | 99.2% (99.3%) | no (no) | 0.38 / 0.28 / 0.30 | 0.15 (0.13) | 0.6 (0.4) | 19.6 (19.1) | 7.6 (7.5) | 245 (224) |
| jev | 1.30 | 0 | 98.6% (99.4%) | no (no) | 0.68 / 0.58 / 0.41 | 0.17 (0.14) | 2.7 (0.6) | 24.4 (21.0) | 8.9 (8.1) | 629 (465) |
| jev | 1.30 | 1 | 99.1% (98.9%) | no (no) | 0.54 / 0.44 / 0.47 | 0.16 (0.13) | 0.9 (1.2) | 22.1 (21.0) | 8.4 (8.0) | 471 (396) |
| jev | 1.36 | 0 | 97.5% (98.6%) | yes (no) | 1.39 / 1.29 / 0.54 | 0.18 (0.15) | 19.2 (2.2) | 26.4 (23.2) | 9.1 (8.5) | 790 (610) |
| jev | 1.36 | 1 | 98.0% (98.6%) | no (no) | 0.92 / 0.82 / 0.55 | 0.17 (0.14) | 9.9 (2.9) | 25.4 (22.3) | 9.2 (8.4) | 754 (569) |
| jev | 1.42 | 0 | 97.2% (98.0%) | yes (yes) | 2.65 / 2.55 / 1.28 | 0.18 (0.16) | 39.4 (16.3) | 28.3 (25.2) | 9.2 (8.7) | 849 (767) |
| jev | 1.42 | 1 | 97.6% (98.2%) | no (no) | 1.51 / 1.41 / 0.71 | 0.17 (0.15) | 19.0 (11.5) | 25.7 (24.1) | 8.9 (8.7) | 735 (706) |
| jev | 1.54 | 0 | 96.0% (96.6%) | yes (yes) | 3.89 / 3.79 / 2.85 | 0.23 (0.18) | 171.6 (88.0) | 33.9 (28.8) | 9.2 (8.8) | 1228 (942) |
| jev | 1.54 | 1 | 96.1% (96.3%) | yes (yes) | 4.08 / 3.98 / 3.99 | 0.26 (0.20) | 130.5 (128.2) | 34.3 (29.9) | 9.3 (8.9) | 1442 (1118) |
| oracle | 1.10 | 0 | 99.9% (99.9%) | no (no) | 0.05 / 0.05 / 0.03 | 0.05 (0.03) | 0.3 (0.3) | 17.9 (17.8) | 7.2 (7.1) | 82 (86) |
| oracle | 1.20 | 0 | 99.9% (99.8%) | no (no) | 0.05 / 0.04 / 0.03 | 0.05 (0.03) | 0.3 (0.3) | 19.4 (18.5) | 7.7 (7.5) | 186 (150) |
| oracle | 1.30 | 0 | 99.5% (99.5%) | no (no) | 0.43 / 0.43 / 0.11 | 0.06 (0.05) | 0.4 (0.5) | 22.4 (20.4) | 8.7 (8.1) | 386 (364) |
| oracle | 1.30 | 1 | 99.7% (99.6%) | no (no) | 0.35 / 0.34 / 0.07 | 0.06 (0.04) | 0.5 (0.4) | 21.8 (20.1) | 8.6 (8.0) | 356 (313) |
| oracle | 1.36 | 0 | 99.2% (99.3%) | no (no) | 0.67 / 0.66 / 0.44 | 0.07 (0.06) | 0.5 (0.5) | 23.4 (21.9) | 8.8 (8.4) | 408 (413) |
| oracle | 1.36 | 1 | 99.4% (99.6%) | no (no) | 0.39 / 0.38 / 0.34 | 0.07 (0.05) | 0.5 (0.4) | 23.0 (21.0) | 9.0 (8.3) | 428 (319) |
| oracle | 1.42 | 0 | 99.2% (99.2%) | yes (no) | 0.96 / 0.95 / 0.69 | 0.06 (0.06) | 0.5 (0.5) | 24.4 (23.1) | 8.8 (8.6) | 374 (516) |
| oracle | 1.42 | 1 | 99.4% (99.5%) | no (no) | 0.52 / 0.51 / 0.47 | 0.08 (0.05) | 0.5 (0.4) | 23.6 (22.6) | 9.0 (8.6) | 505 (422) |
| oracle | 1.54 | 0 | 98.7% (98.9%) | yes (yes) | 1.10 / 1.09 / 1.00 | 0.09 (0.07) | 2.1 (1.2) | 26.0 (25.1) | 8.9 (8.7) | 602 (489) |
| oracle | 1.54 | 1 | 98.9% (99.2%) | no (no) | 2.20 / 2.20 / 0.99 | 0.09 (0.08) | 0.5 (0.7) | 28.1 (25.2) | 9.4 (9.0) | 663 (653) |